Abstract
Independent component analysis (ICA) is a popular analysis technique for neuroimaging data. Spatial ICA (SICA) decomposes the time by space functional MRI (fMRI) matrix into a set of 1-D basis time courses and their associated 3-D spatial maps which are optimized for non-Gaussianity and hence mutual independence.
- When applied to resting state fMRI (rsfMRI), SICA produces several interesting spatial components, the so called resting state networks (RSNs).
- The mixing matrix in ICA is identifiable provided that the number of Gaussian sources in the mixture is at most 1. Unfortunately, the contrast function in ICA depends on the finite observed data and is non-convex with potentially many local minima. This means that each run of ICA will produce potentially different RSN networks for the same data!
- A technique to deal with the run to run variability of ICA was proposed in Yang et al. (2008) in their algorithm RAICAR (Ranking and averaging independent component analysis by reproducibility). The basic idea is to select only those ICA components as "interesting" which show a high run to run "reproducibility".
- We propose a simple enhancement to the original RAICAR algorithm to attach "reproducibility" p-values to each ICA component from RAICAR.
Examples of the application of RAICAR_N to human rsfMRI data in single subject and group mode
rsfMRI data titled:
Baltimore (Pekar, J.J./Mostofsky, S.H.; n = 23 [8M/15F]; ages: 20-40; TR = 2.5; # slices = 47; # timepoints = 123) was downloaded from
http://www.nitrc.org/. Data was analyzed using tools from the FMRIB software library (FSL,
http://www.fmrib.ox.ac.uk/fsl/). Preprocessing steps included motion correction, brain extraction, spatial smoothing with an isotropic Gaussian kernel of 5mm FWHM and 100s high-pass temporal filtering. Spatial ICA was performed using FSL MELODIC in either single subject or multi-subject temporal concatenation mode. In each case, we fixed the number of ICA components at 40. For temporal concatenation mode, single subject data was affinely registered to the MNI 152 brain and subsequently resampled to 4x4x4 resolution (MNI 4x4x4).
Multisubject with 1 ICA run per subject
-
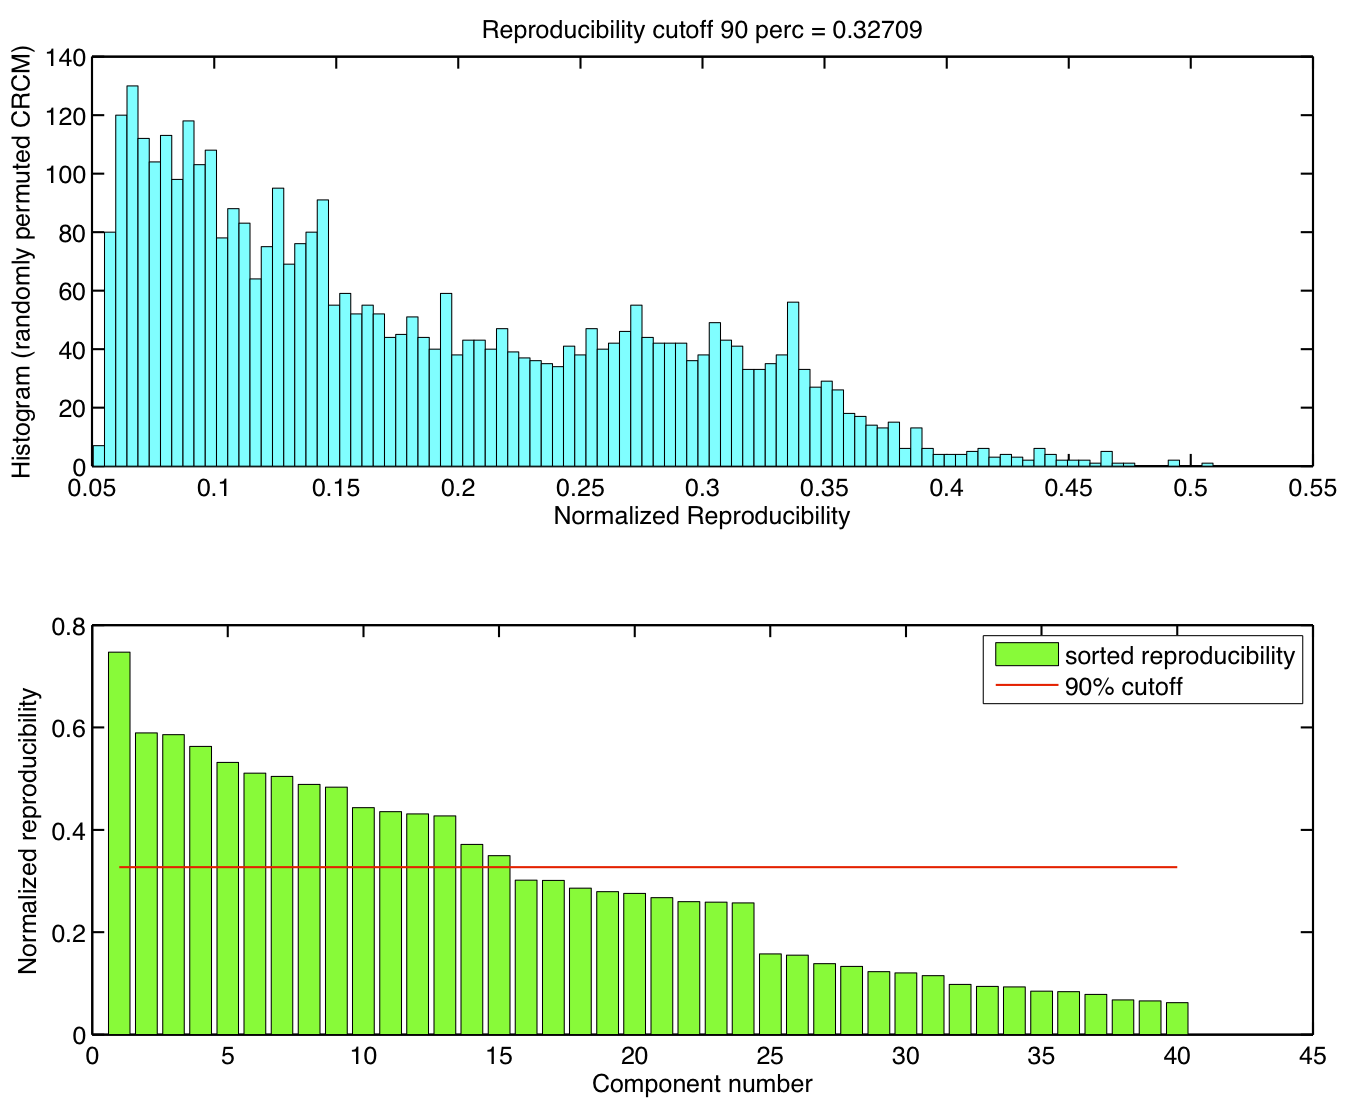
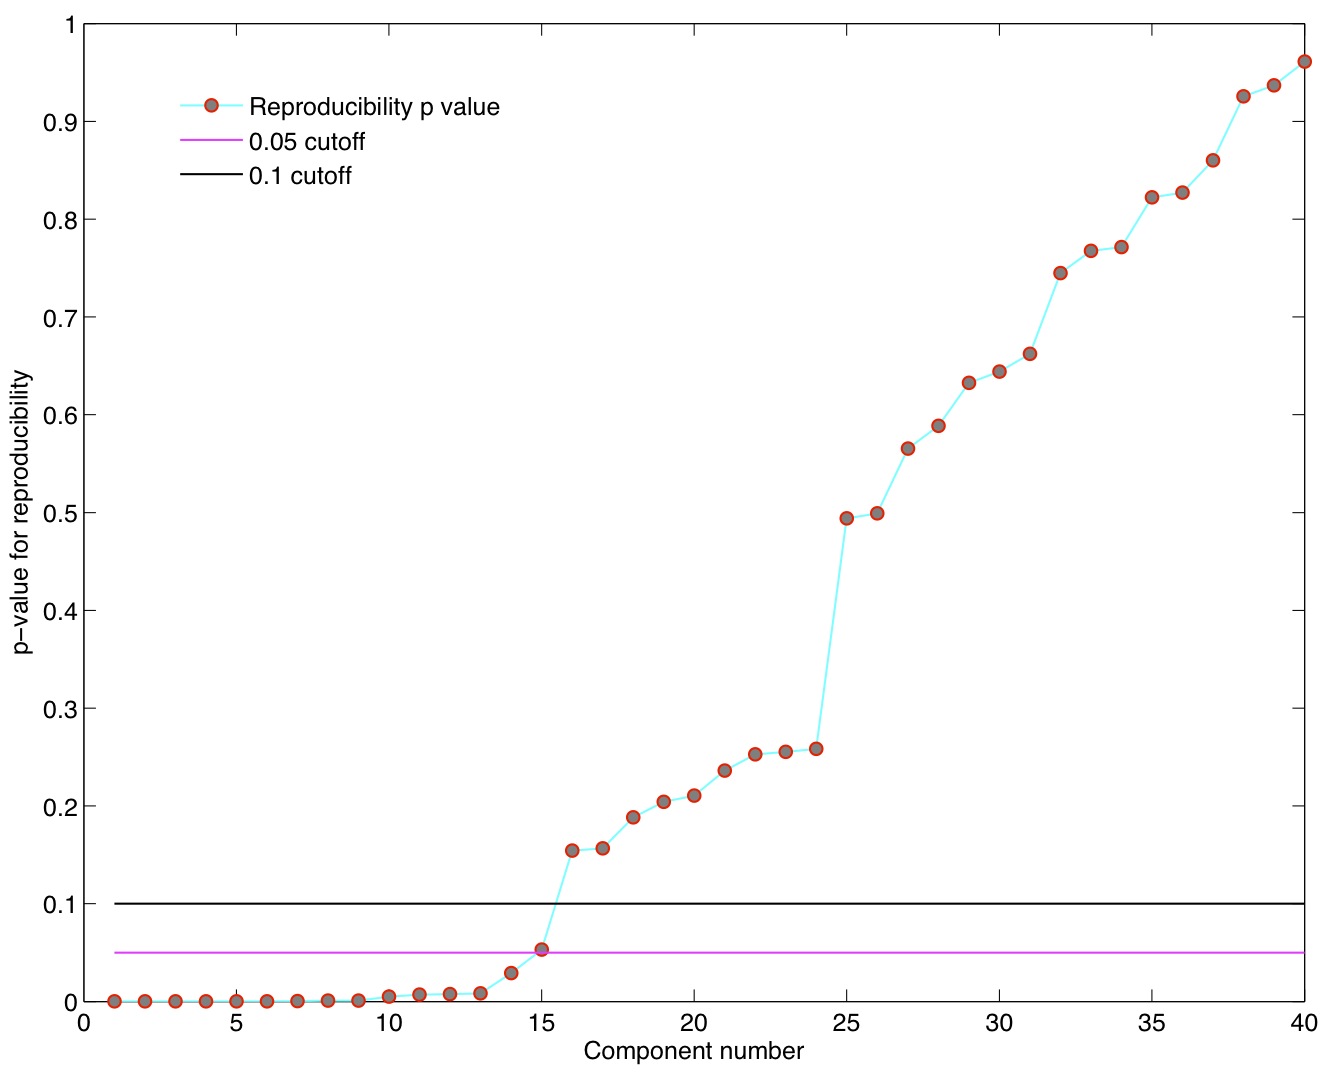
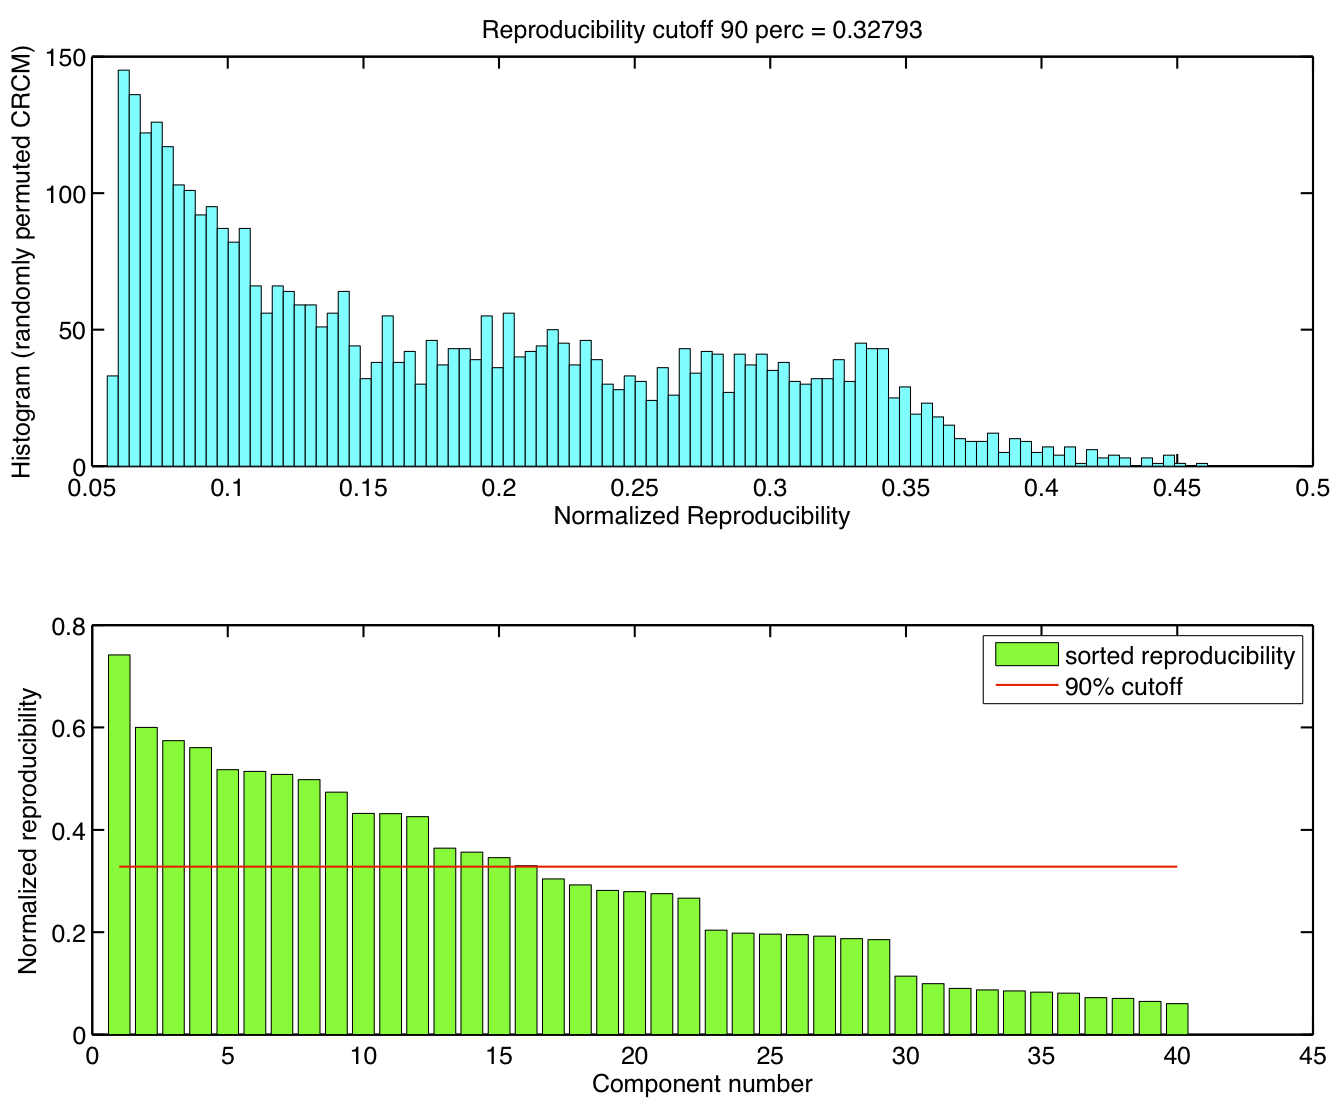
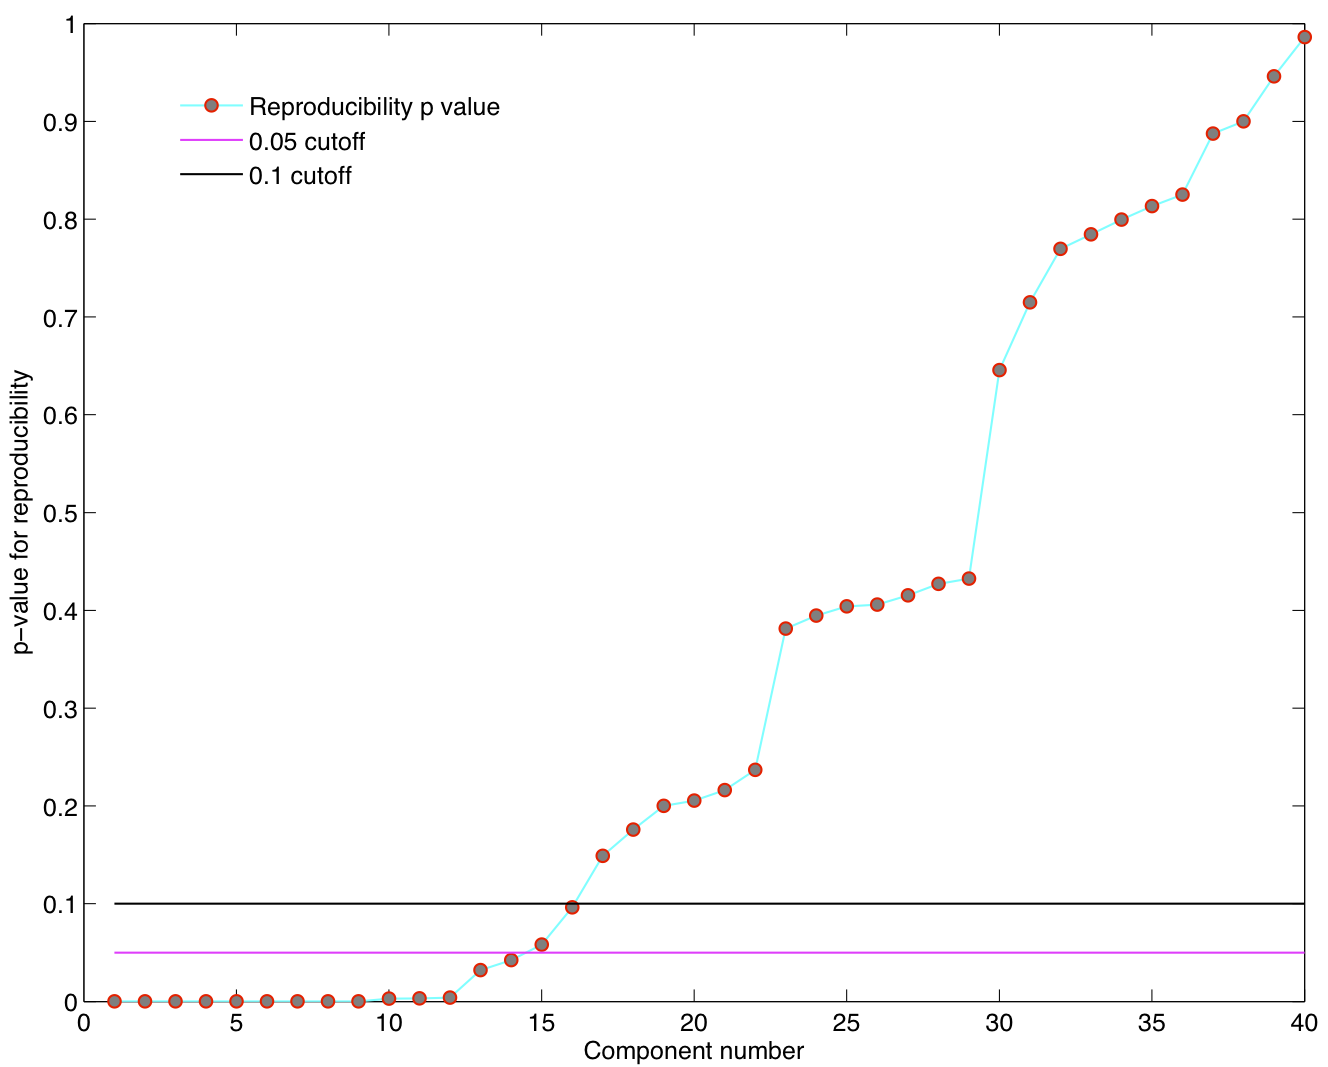
Reproducibility p-values
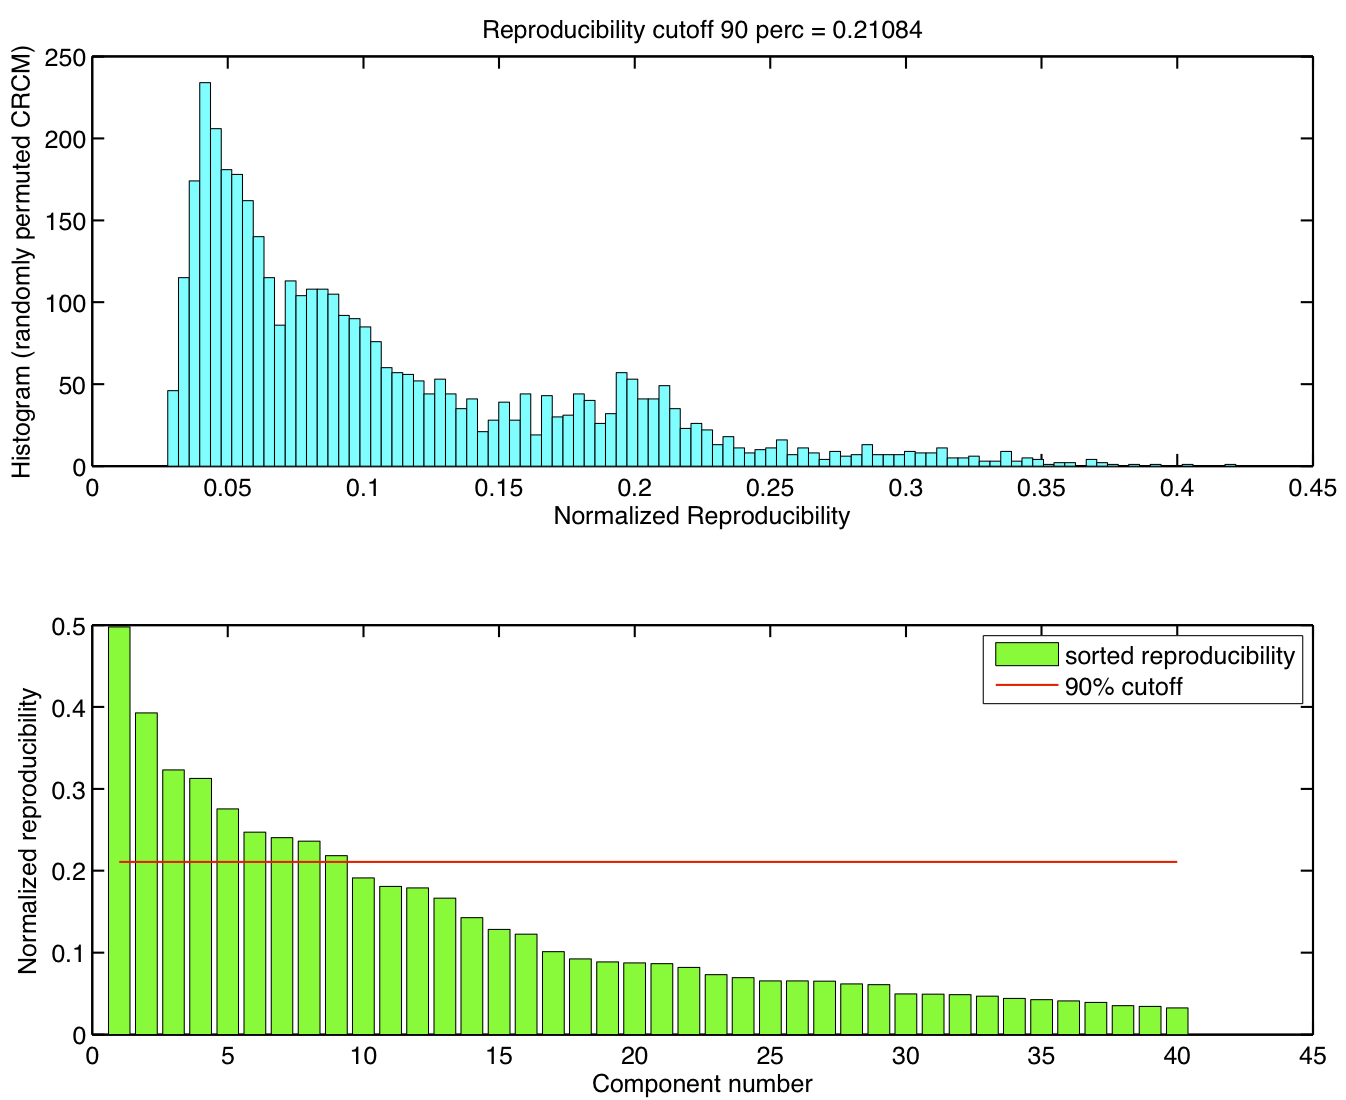
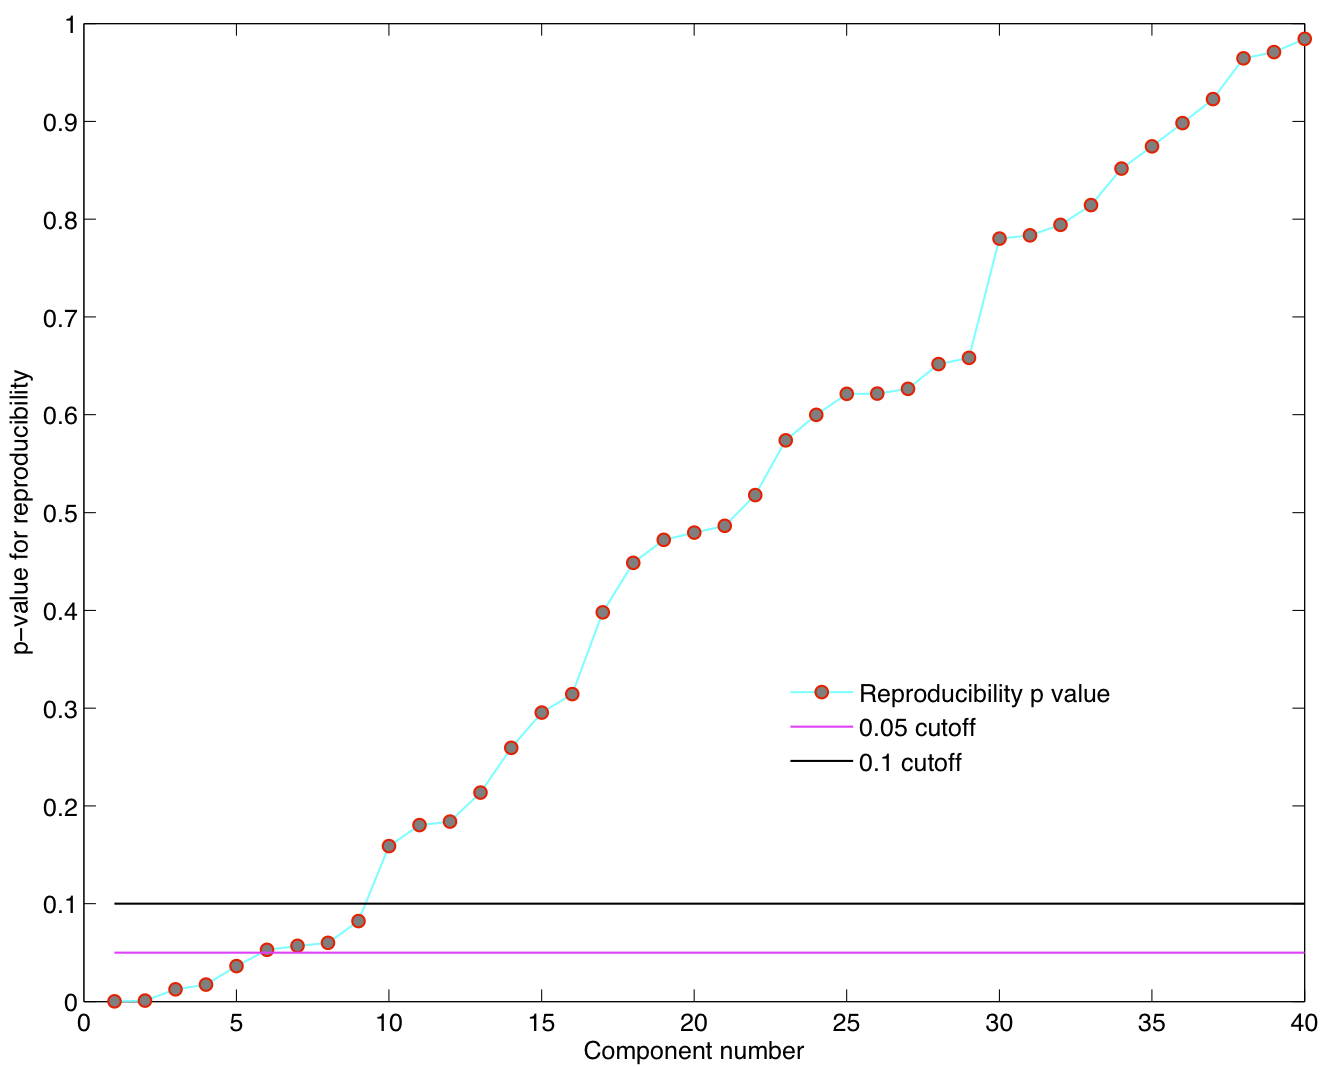
Spatial ICA was run once for each of the 23 subjects in their native space. The resulting set of ICA components across subjects were transformed to MNI 4x4x4 space and were submitted to a RAICAR_N analysis.
ICA components were sorted according to their reproducibility and p-values were computed for each ICA component.
-
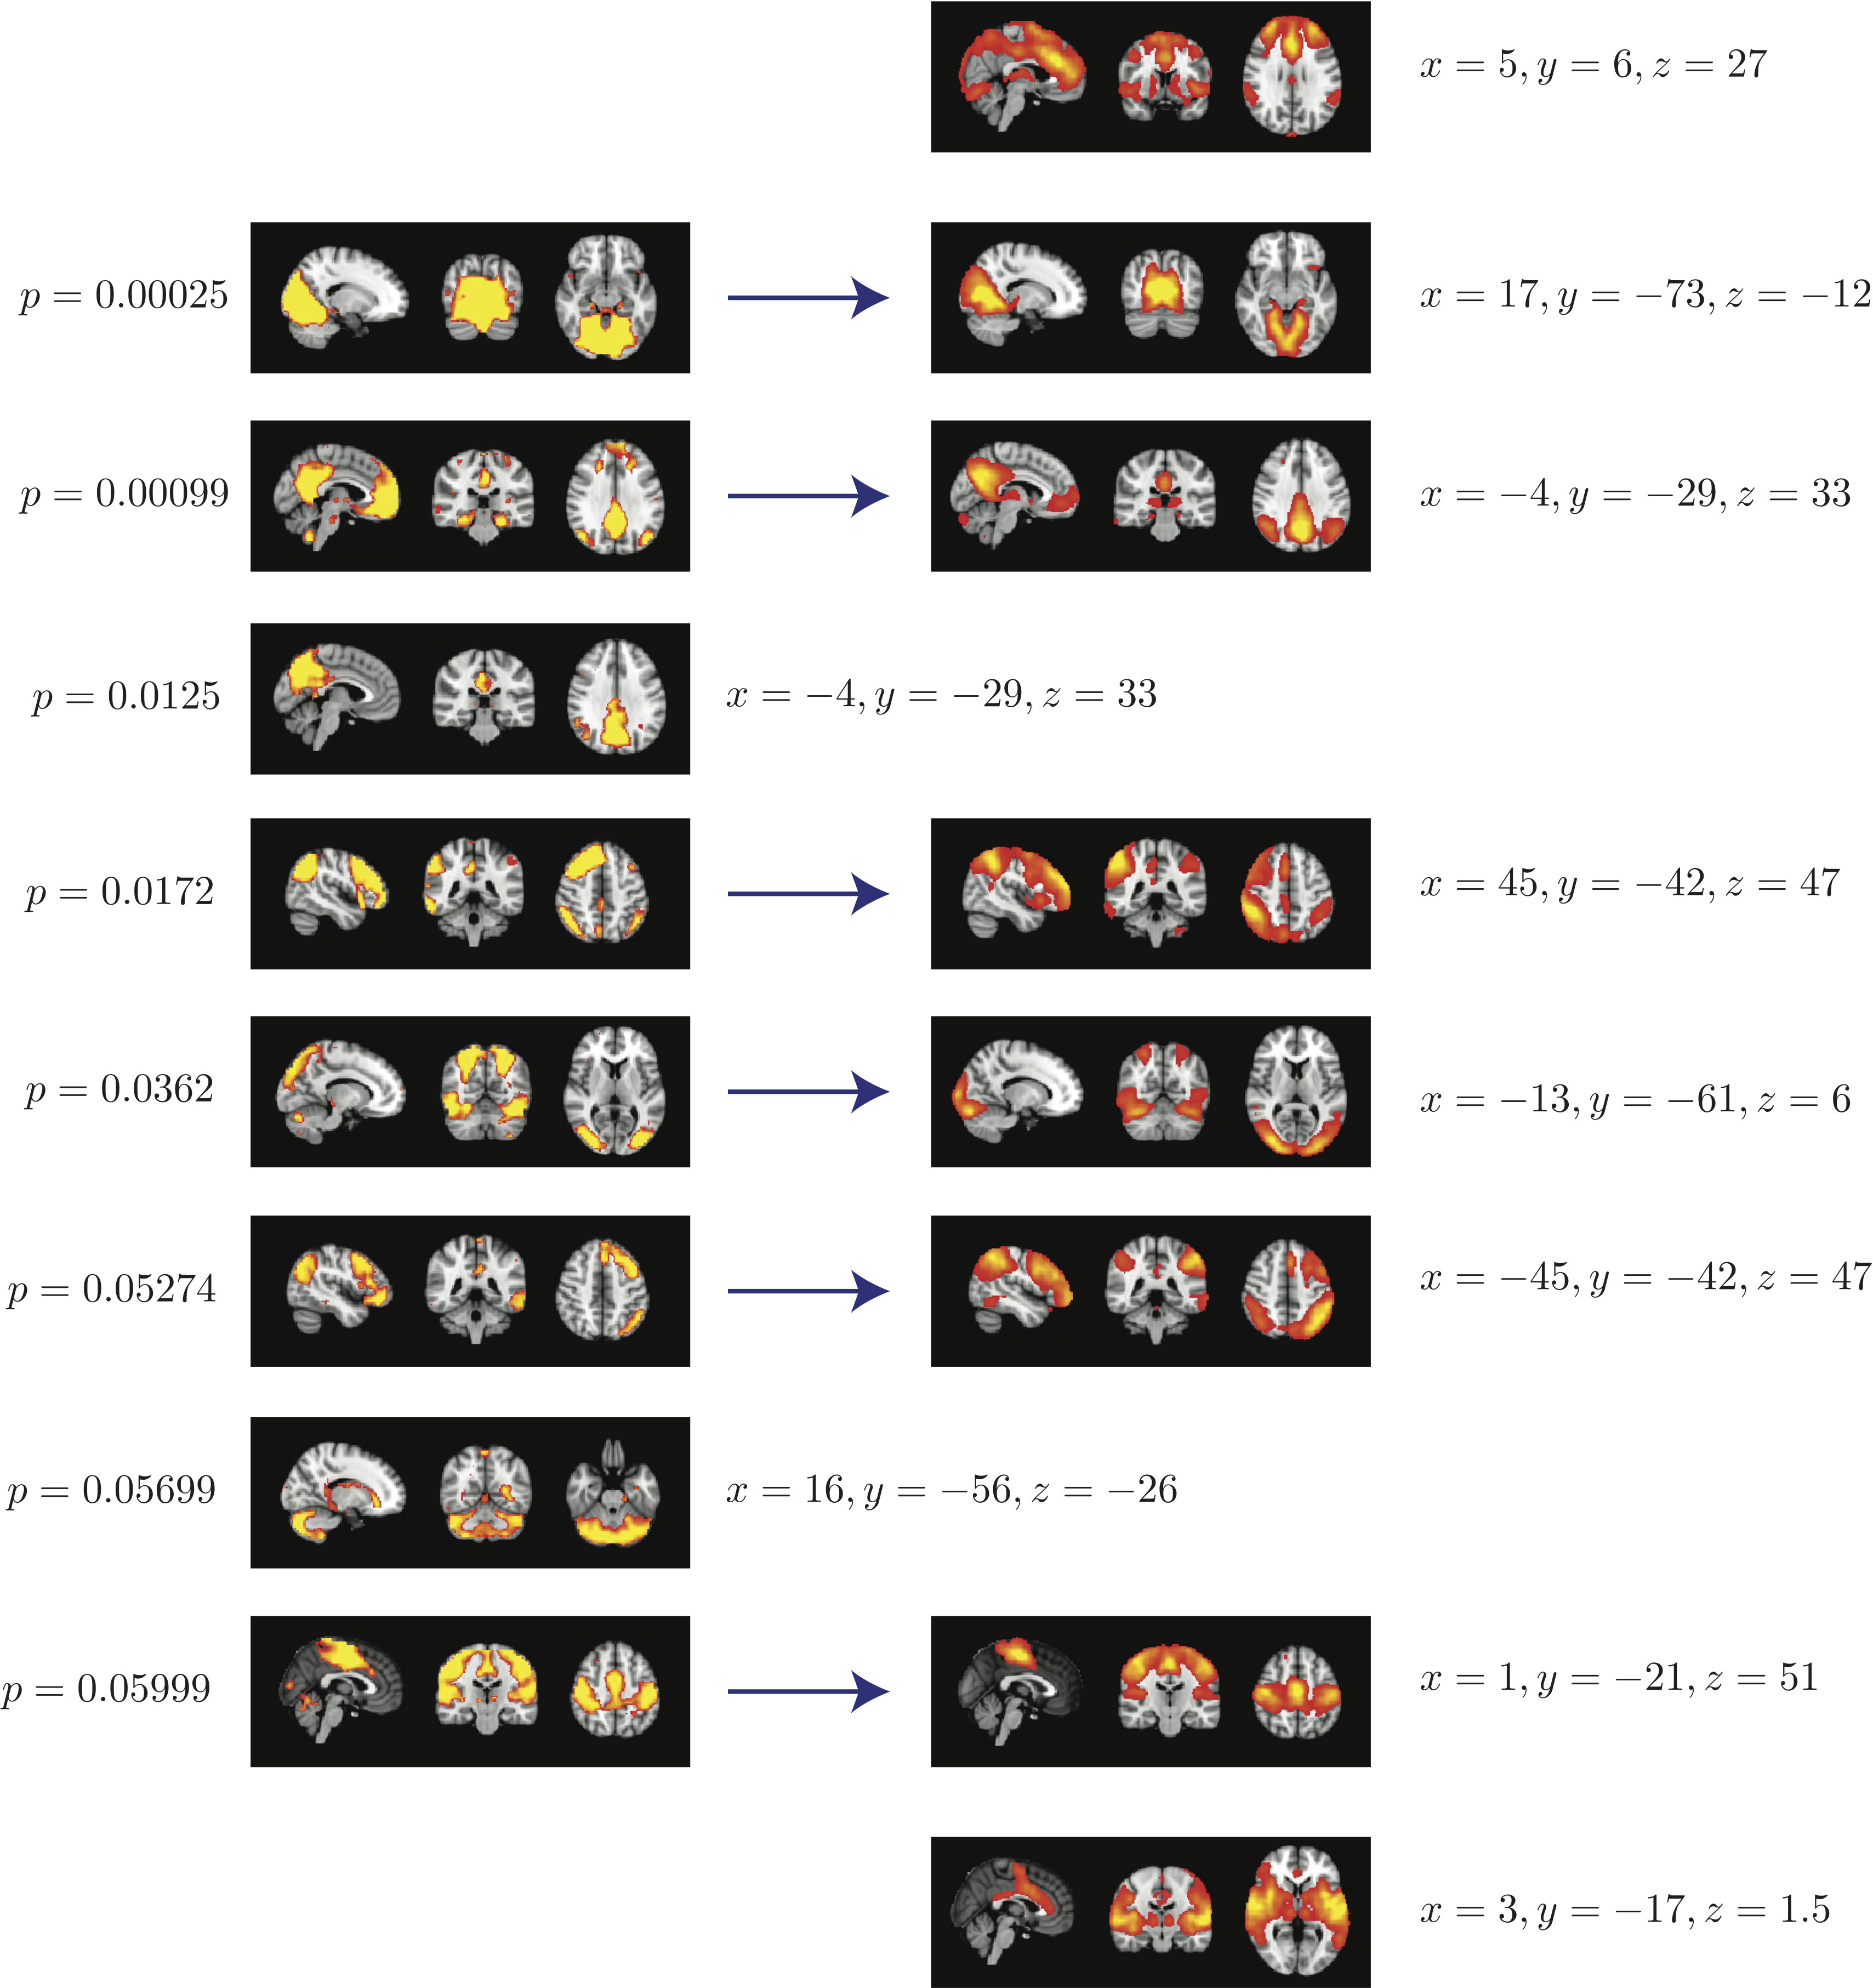
Top 8 components with highest reproducibility compared with "standard" RSN maps found in literature
-
Summary
When single subject ICA runs are combined across subjects:
- We are able to declare 4 "standard" RSNs as significantly reproducible at a p-value < 0.05.
- There are 2 other "standard" RSNs that achieve a reproducibility p-value between 0.05 and 0.06.
- There are 2 other "non-standard" RSNs that are of interest: one achieves a p-value of 0.0125 and the other achieves a p-value of 0.05699.
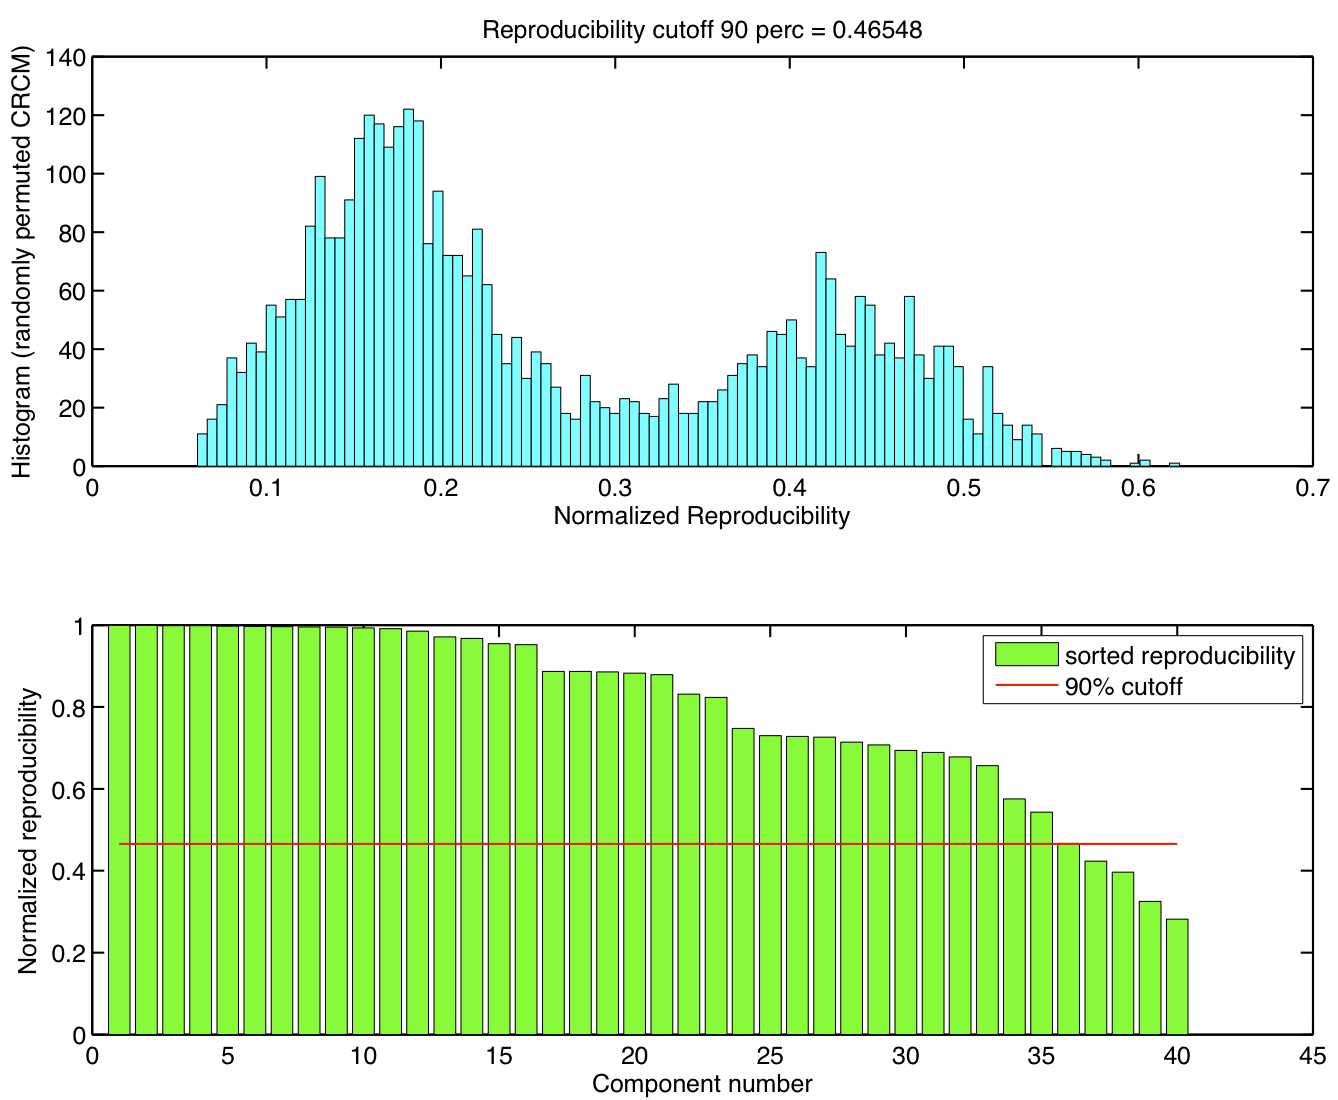
Random sets of 5 subjects - 50 group ICA runs
-
Reproducibility p-values
5 subjects were drawn at random from the group of 23 subjects and submitted to a temporal concatenation based group ICA. This process was repeated 50 times and the resulting set of 50 group ICA maps were submitted to a RAICAR_N analysis.
ICA components were sorted according to their reproducibility and p-values were computed for each ICA component.
-
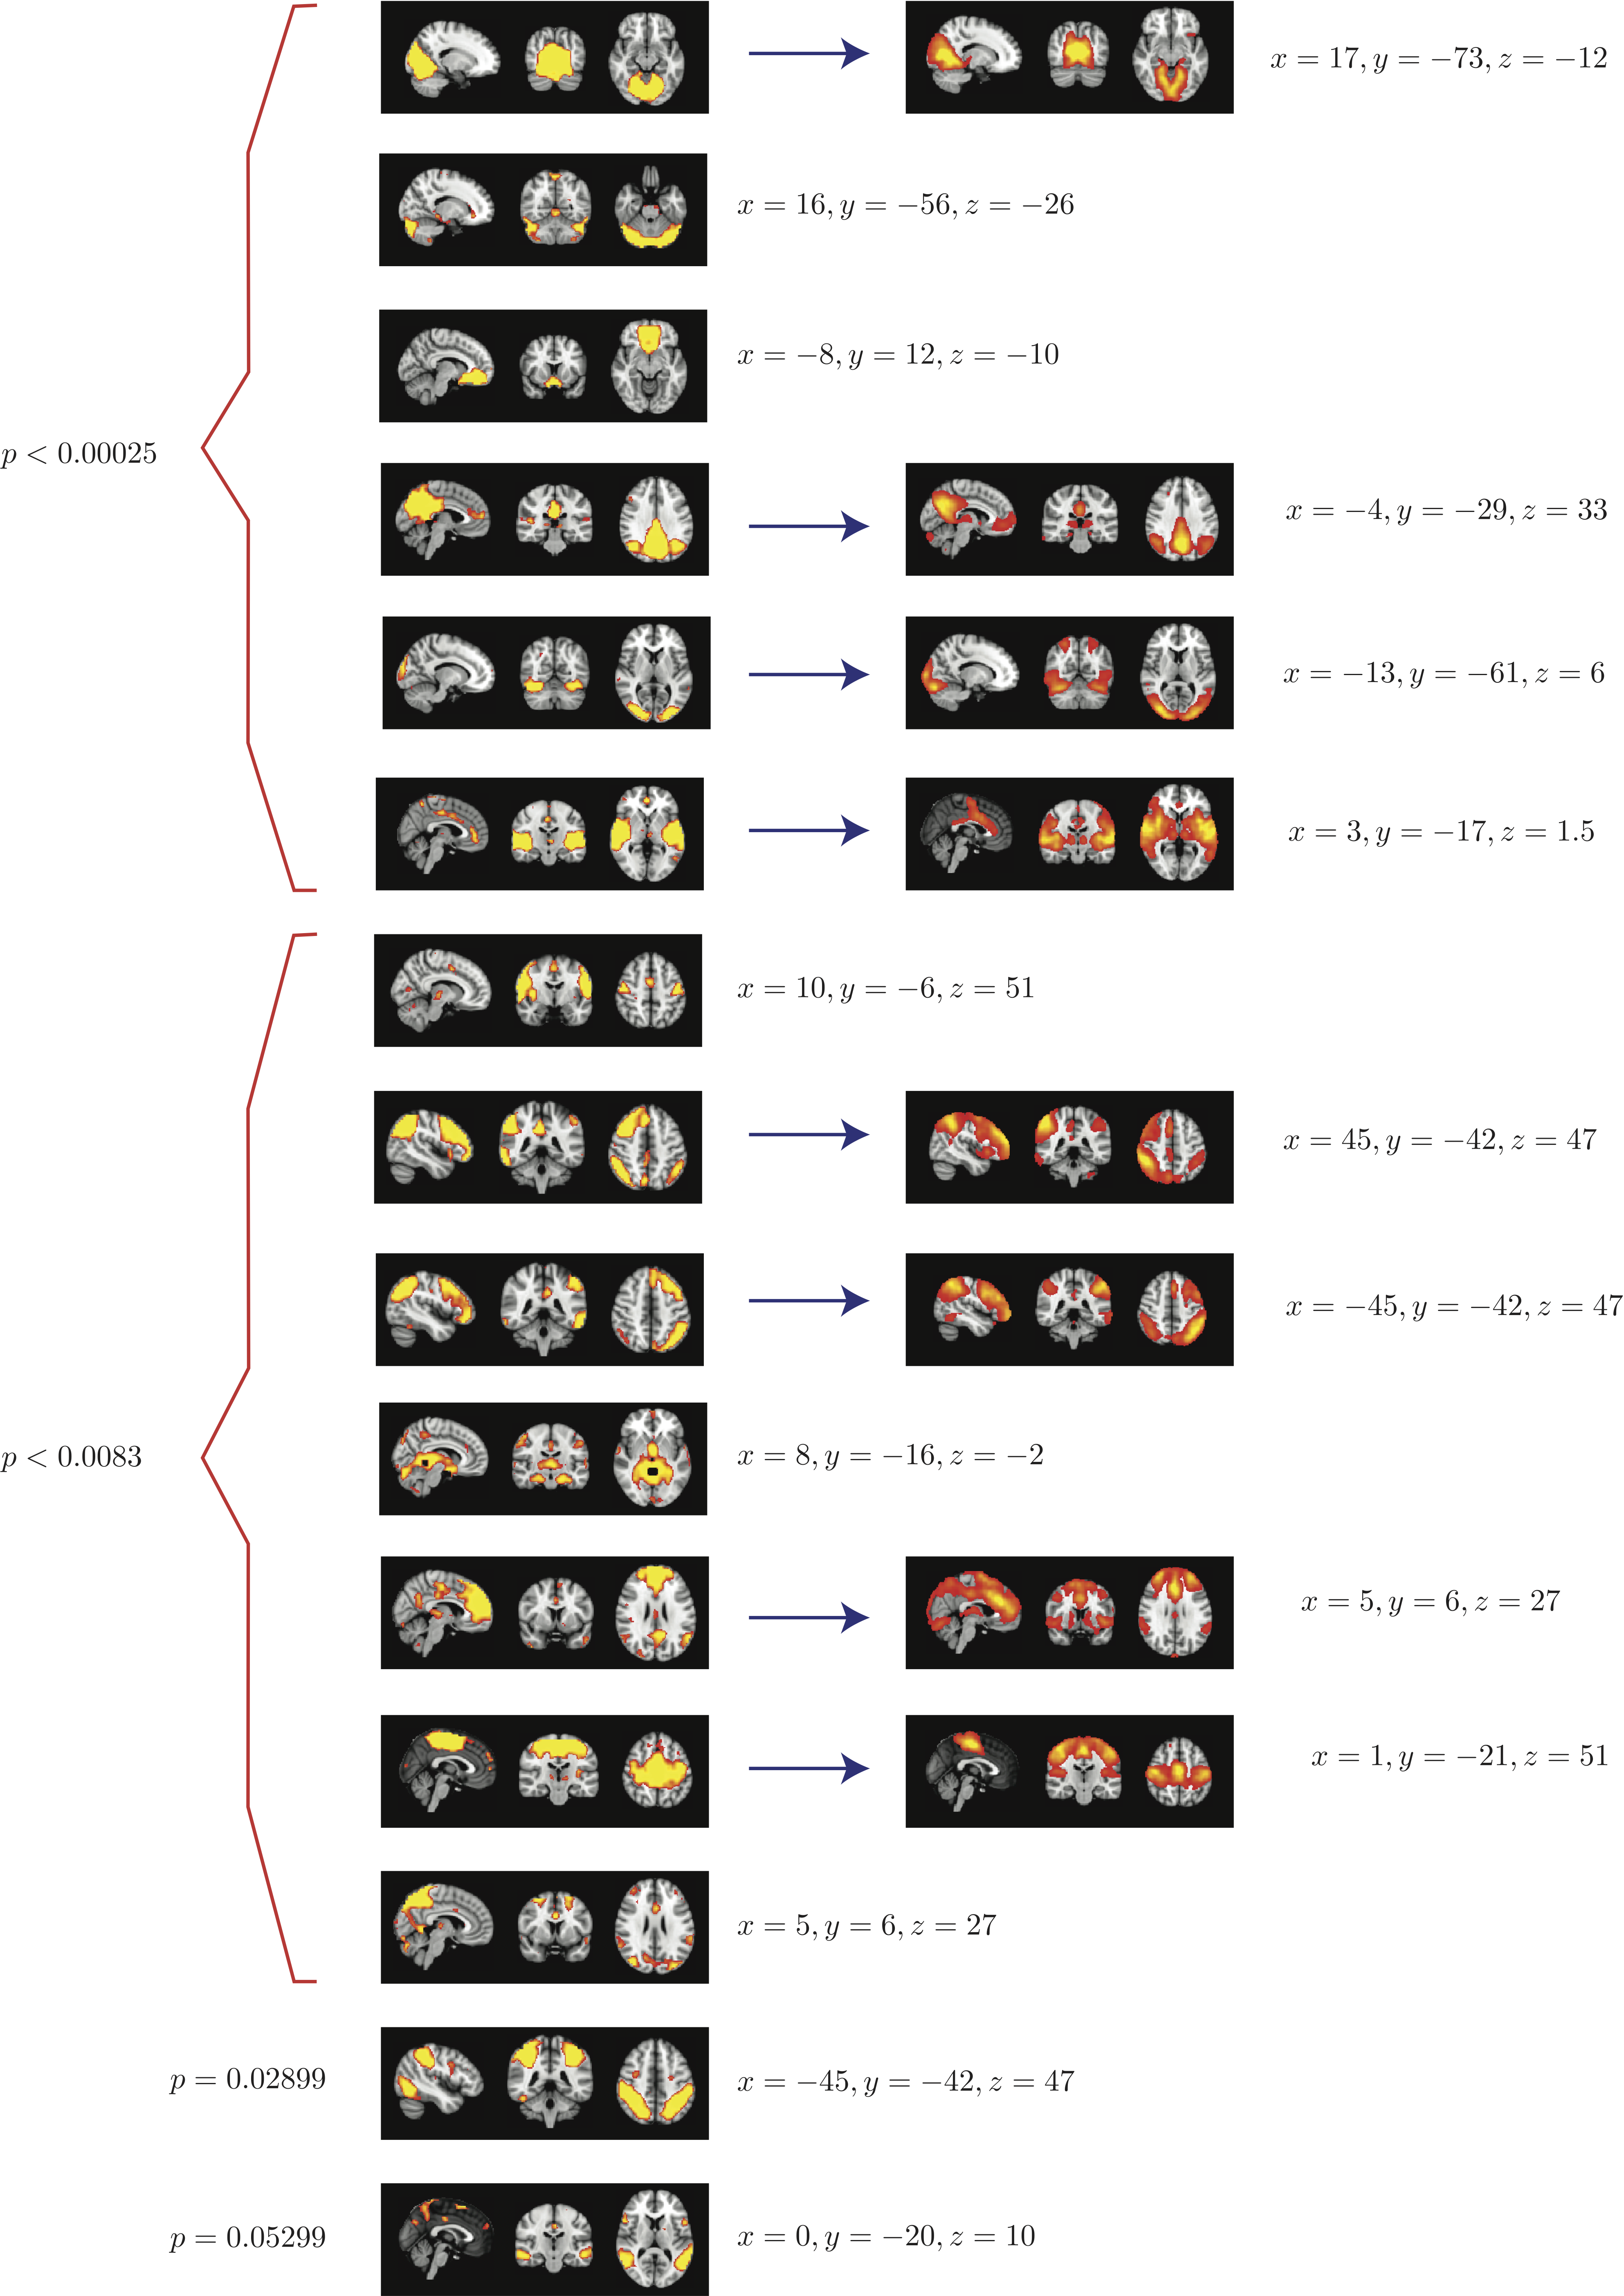
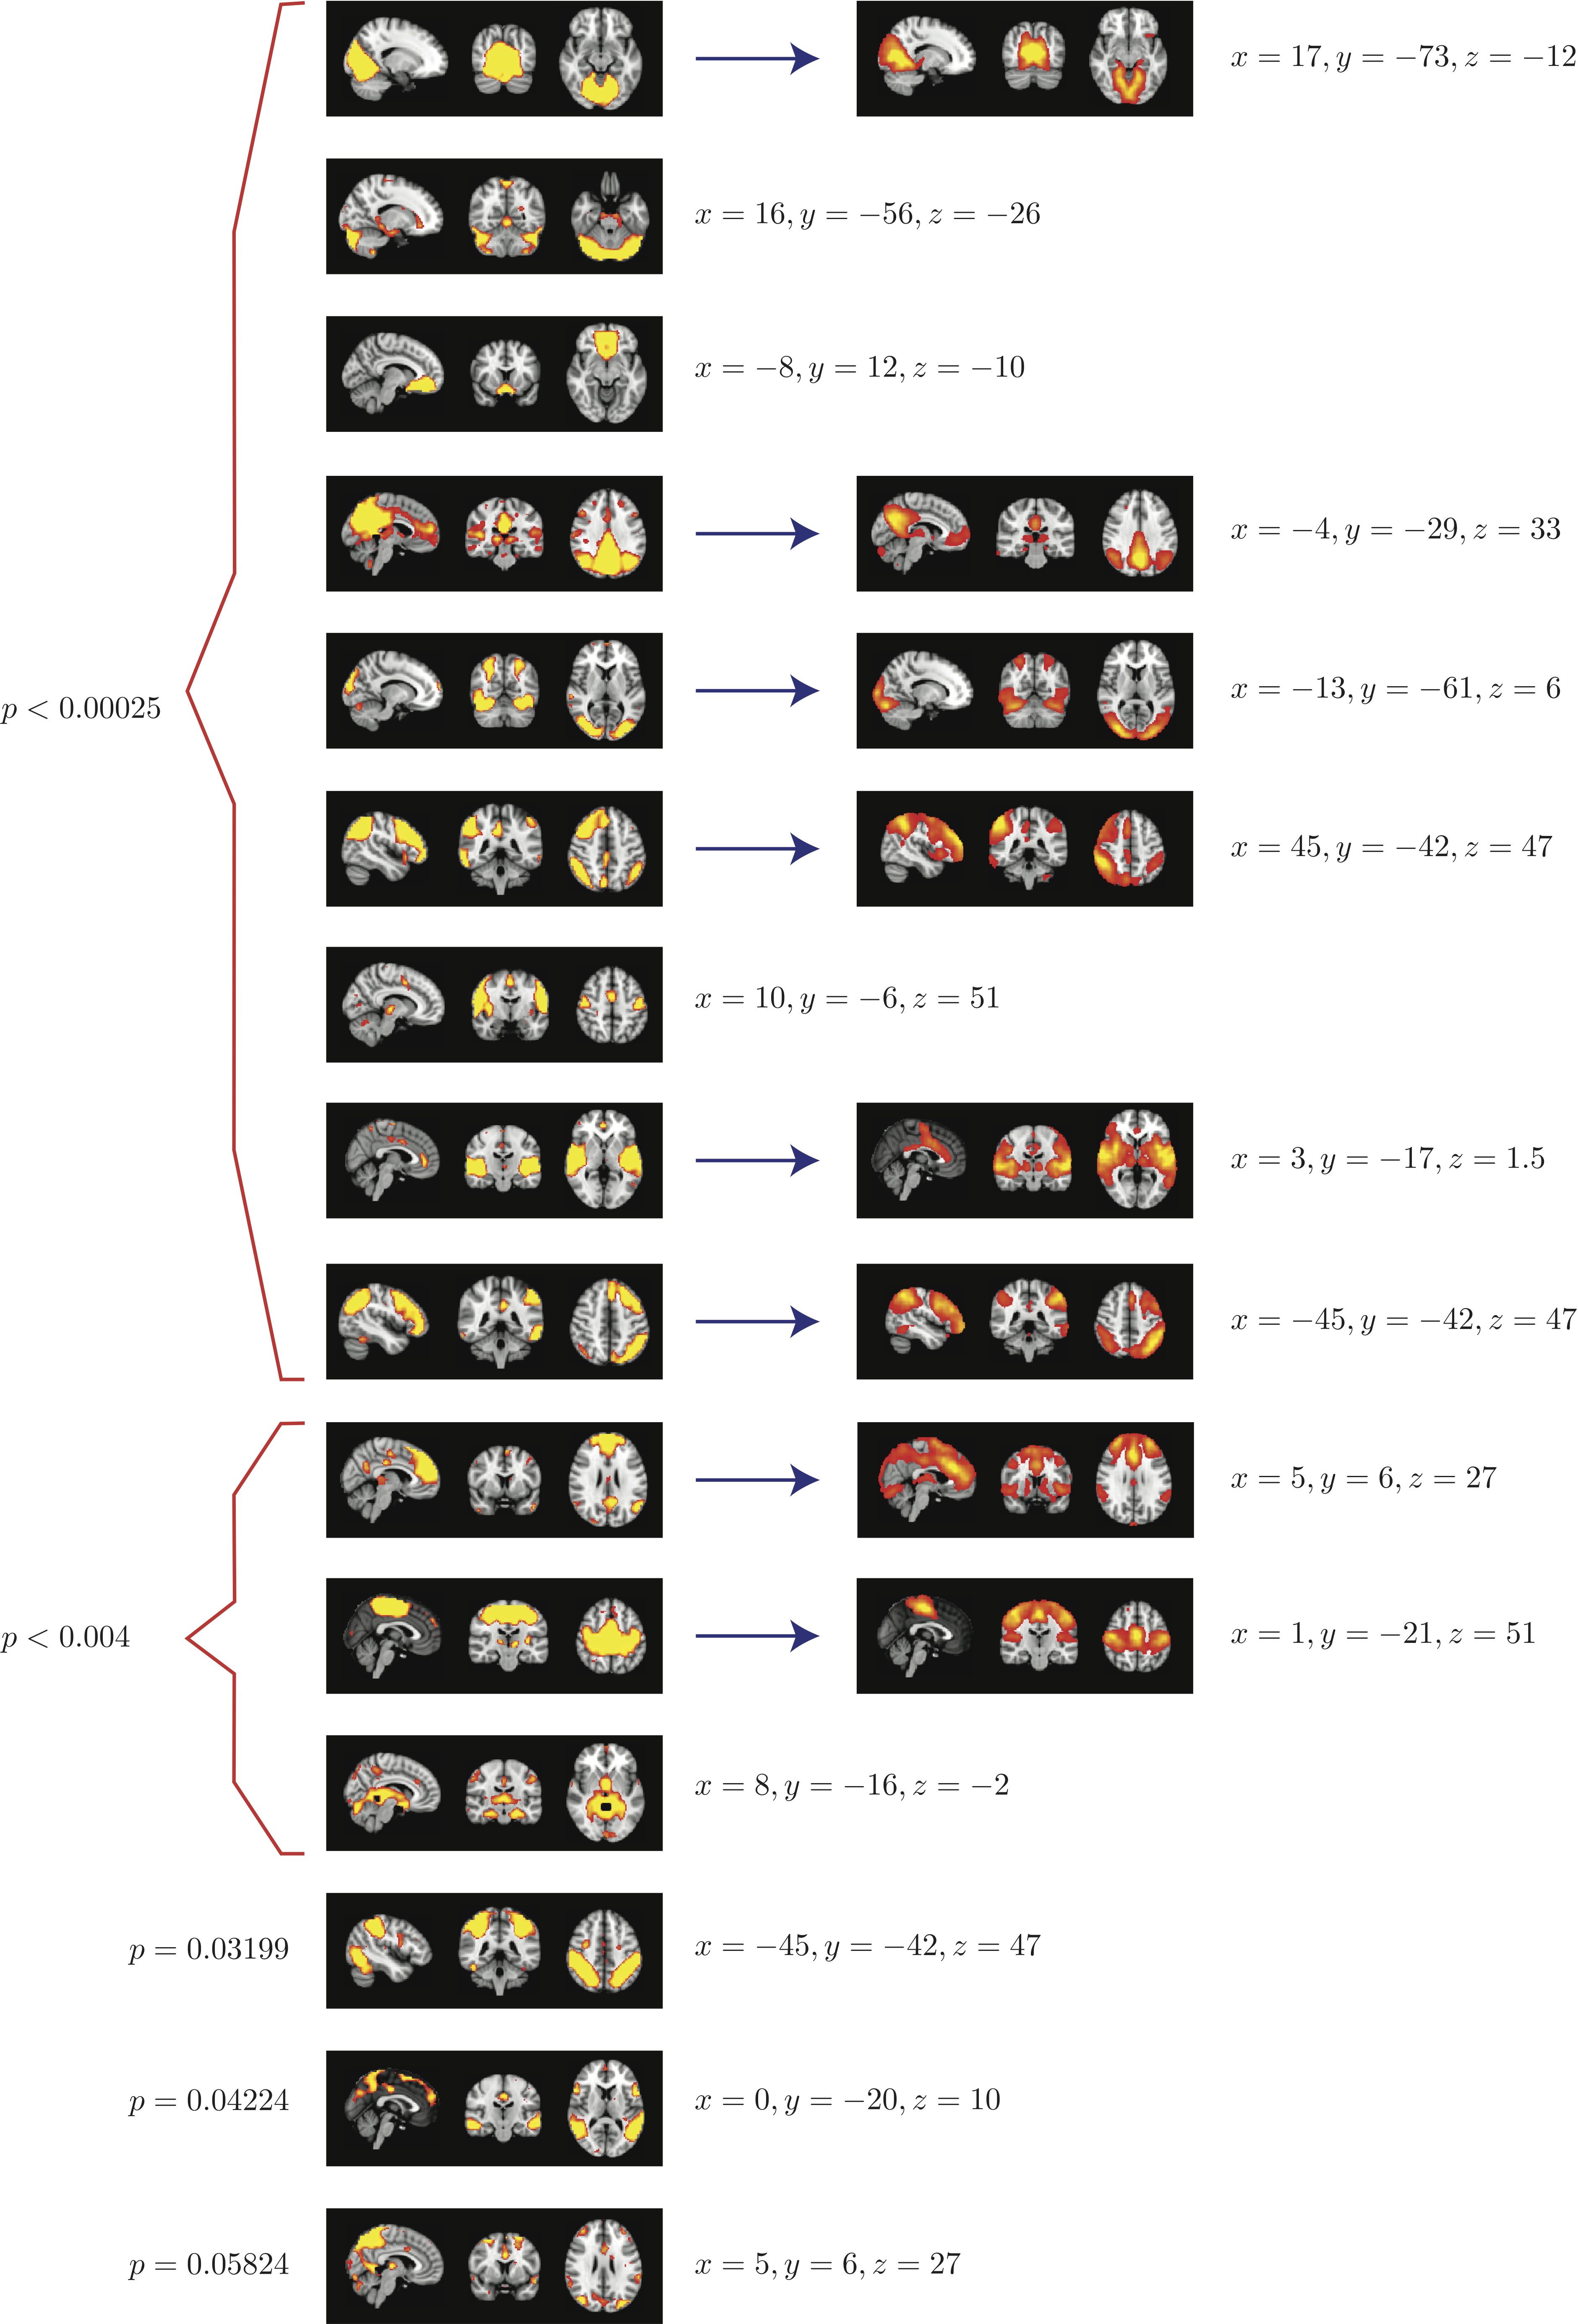
Top 15 components with highest reproducibility compared with "standard" RSN maps found in literature
-
Summary
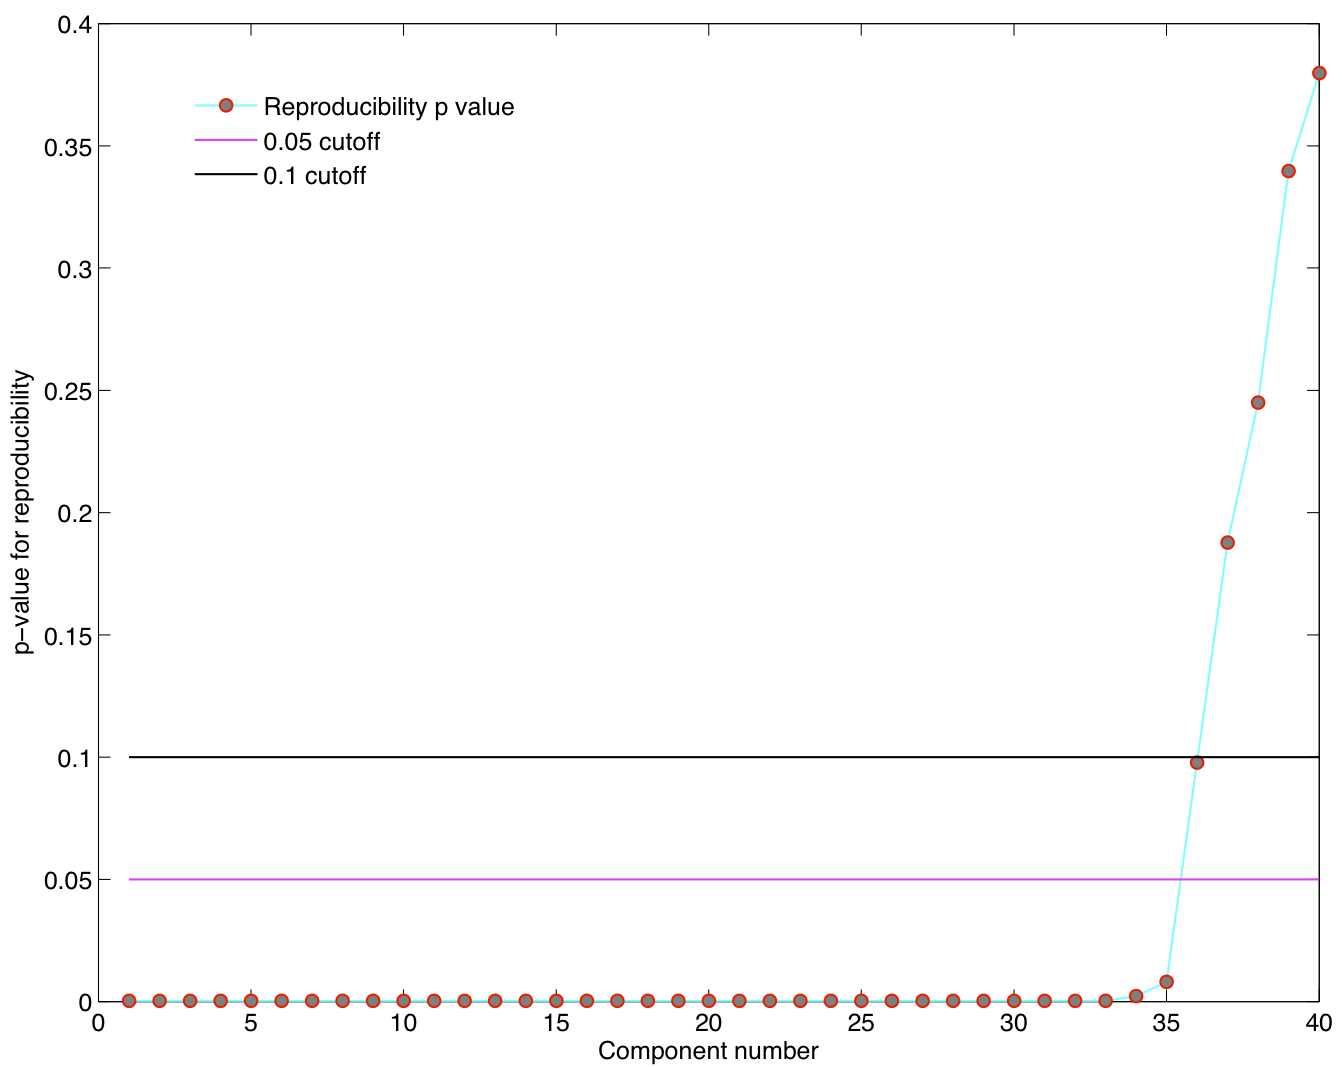
When 50 random 5 subject group ICA runs (from a population of 23 subjects) are combined using RAICAR_N:
- We are able to declare 8 "standard" RSNs as significantly reproducible at a p-value < 0.05.
- There are 6 other "non-standard" RSNs that can be declared as significantly reproducible at a p-value < 0.05.
- There is 1 other "non-standard" RSN that achieves a p-value of 0.05299.
Random sets of 5 subjects - 100 group ICA runs
-
Reproducibility p-values
5 subjects were drawn at random from the group of 23 subjects and submitted to a temporal concatenation based group ICA. This process was repeated 100 times and the resulting set of 100 group ICA maps were submitted to a RAICAR_N analysis.
ICA components were sorted according to their reproducibility and p-values were computed for each ICA component.
-
Top 15 components with highest reproducibility compared with "standard" RSN maps found in literature
-
Summary
When 100 random 5 subject group ICA runs (from a population of 23 subjects) are combined using RAICAR_N:
- We are able to declare 8 "standard" RSNs as significantly reproducible at a p-value < 0.05.
- There are 6 other "non-standard" RSNs that can be declared as significantly reproducible at a p-value < 0.05.
- There is 1 other "non-standard" RSN that achieves a p-value of 0.05824.
 ] (this work)